The JavaScript browser error tracking market has undergone significant changes in 2024. I had previously set up a self-hosted instance of Sentry, but they've introduced a breaking change with version 8 of their JavaScript library, now based on OpenTelemetry. Unfortunately, this v8 SDK isn't compatible with my self-hosted Sentry instance, and updating seems too complex at the moment.
Considering this, I thought about bypassing the middleman and going directly to OpenTelemetry as the source. However, I discovered that OpenTelemetry for JavaScript isn't yet a complete replacement for Sentry. While it excels at tracing, it falls short when it comes to logging.
Moreover, I found that all OpenTelemetry-compatible tools—including Sentry—primarily accept OpenTelemetry data but then convert it into their own proprietary format, supporting only that API.
By sheer luck, I discovered that Grafana’s wrapper, Faro, has some of the Sentry-like features that I was missing (simple exception handling, console.log interception) and has an alternative experimental Transport @grafana/faro-transport-otlp-http that allows export to OpenTelemetry format.
I tried this with Honeycomb.io as shown below:
import { ErrorHandler, Provider } from '@angular/core'
import { OtlpHttpTransport } from '@grafana/faro-transport-otlp-http'
import {
    getWebInstrumentations,
    initializeFaro,
    LogLevel,
} from '@grafana/faro-web-sdk'
import {
    getDefaultOTELInstrumentations,
    TracingInstrumentation,
} from '@grafana/faro-web-tracing'
import { DocumentLoadInstrumentation } from '@opentelemetry/instrumentation-document-load'
import { UserInteractionInstrumentation } from '@opentelemetry/instrumentation-user-interaction'

const faro = initializeFaro({
    app: {
        name: 'my-app',
    },
    sessionTracking: {
        enabled: true,
    },
    transports: [
        new OtlpHttpTransport({
            logsURL: 'https://api.honeycomb.io/v1/logs',
            tracesURL: 'https://api.honeycomb.io/v1/traces',
            requestOptions: {
                headers: {
                    'x-honeycomb-team': '{{HONEYCOMB_TEAM_HERE}}',
                },
            },
        }),
    ],
    instrumentations: [
        ...getWebInstrumentations({
            captureConsole: true,
            captureConsoleDisabledLevels: [LogLevel.DEBUG, LogLevel.TRACE],
        }),
        new TracingInstrumentation({
            instrumentations: [
                ...getDefaultOTELInstrumentations({
                    ignoreUrls: [/api.honeycomb.io/],
                }),
                new DocumentLoadInstrumentation(),
                new UserInteractionInstrumentation(),
            ],
        }),
    ],
})
If you are using Angular and Zone.js, you can manually set the contextManager to the context-zone-peer-dep, and also provide your own custom Angular ErrorHandler to catch template errors:
import { ZoneContextManager } from '@opentelemetry/context-zone-peer-dep';
import { ErrorHandler, Provider } from '@angular/core';

// ...
new TracingInstrumentation({
  instrumentations: [
    ...getDefaultOTELInstrumentations({
      ignoreUrls: [/api.honeycomb.io/],
    }),
    new DocumentLoadInstrumentation(),
    new UserInteractionInstrumentation(),
  ],
  contextManager: new ZoneContextManager(), // using peer-dep version because this is Angular
}),
// ...

const myErrorHandler: ErrorHandler = {
  handleError(error) {
    console.error(error);
    faro.api.pushError(error);
  },
};

export const tracingProviders: Provider[] = [
  {
    provide: ErrorHandler,
    useValue: myErrorHandler,
  },
];
It still feels quite difficult to actually do any logging. I'm not sure how to get the active span, or if I should use the same span or create a new one. When in doubt, create a new span, I suppose, because it makes it easier to see what is happening in the trace. In any case, through trial and error, I was able to create the following function wrapper which seemed to work:
export function wrapFn<T>(fn: () => T, name?: string): Promise<Awaited<T>> {
    const otel = faro.api.getOTEL()
    if (!otel) throw new Error('Faro not initialized')

    const tracer = otel.trace.getTracer('default')

    const result = tracer.startActiveSpan(name ?? 'wrap-fn', async (span) => {
        try {
            const result = await fn()
            span.setStatus({ code: SpanStatusCode.OK })
            return result
        } catch (err) {
            faro.api.pushError(err as any)

            span.setStatus({ code: SpanStatusCode.ERROR, message: String(err) })

            throw err
        } finally {
            span.end()
        }
    })

    return result as any
}
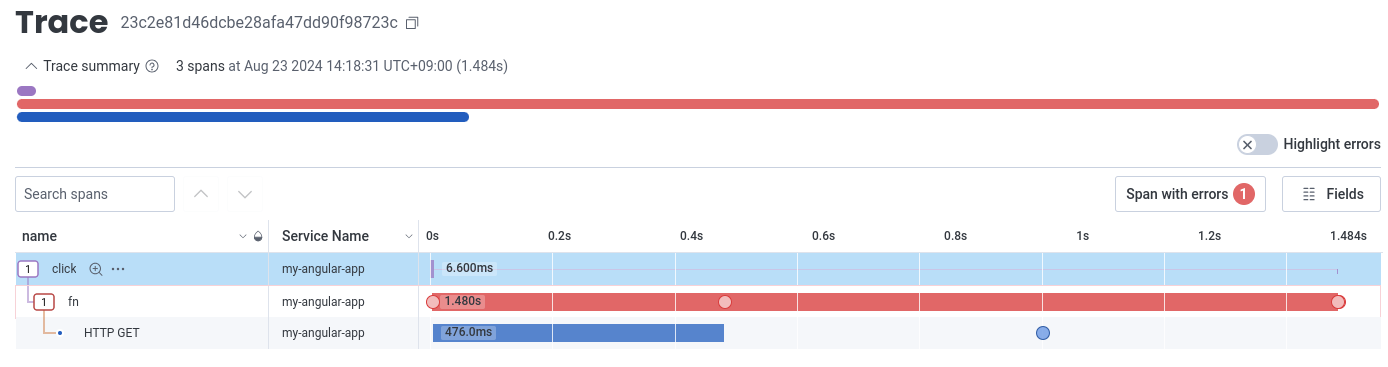
After this, I tried wrapping a click handler in my wrapFn(), called it, and was able to produce the following error trace with information about the error: